Dose-effect relationship. Dose-response curve. Concentration-effect relationship
General remarks
The spectrum of manifestations of the toxic process is determined by the structure of the toxicant. However, the severity of the resulting effect is a function of the amount of active agent.
To denote the amount of a substance acting on a biological object, the concept of dose is used. For example, the introduction of a toxicant in the amount of 500 mg into the stomach of a rat weighing 250 g and a rabbit weighing 2000 g means that the animals were given doses equal to 2 and 0.25 mg/kg, respectively (the concept of “dose” will be discussed in more detail below).
The dose-effect relationship can be traced at all levels of organization of living matter: from molecular to population. In this case, in the overwhelming majority of cases, a general pattern will be recorded: with increasing dose, the degree of damage to the system increases; An increasing number of its constituent elements are involved in the process.
Depending on the effective dose, almost any substance under certain conditions can be harmful to the body. This is true for toxicants acting both locally (Table 1) and after resorption into internal environments (Table 2).
Table 1. Relationship between the concentration of formaldehyde in inhaled air and the severity of the toxic process
(P.M. Misiak, J.N. Miceli, 1986)
Table 2. Relationship between the concentration of ethanol in the blood and the severity of the toxic process
(T.G. Tong, D. Pharm, 1982)
The manifestation of the dose-effect relationship is significantly influenced by intra- and interspecific variability of organisms. Indeed, individuals belonging to the same species differ significantly from each other in biochemical, physiological, and morphological characteristics. These differences are in most cases due to their genetic characteristics. Due to the same genetic characteristics, interspecific differences are even more pronounced. In this regard, the doses of a particular substance in which it causes damage to organisms of the same and, especially, different species, sometimes differ very significantly. Consequently, the dose-effect relationship reflects the properties not only of the toxicant, but also of the organism on which it acts. In practice, this means that a quantitative assessment of toxicity, based on the study of the dose-effect relationship, should be carried out in experiments on various biological objects, and it is necessary to resort to statistical methods for processing the data obtained.
Dose-effect relationship at the level of individual cells and organs
2.1. Preliminary remarks
The simplest object needed to record the biological effect of a toxicant is a cell. When studying the mechanisms of toxic action, this provision is often omitted, concentrating attention on assessing the characteristics of the interaction of a chemical substance with target molecules (see above). Such a simplified approach, justified at the initial stages of work, is completely unacceptable when moving on to the study of the basic regularity of toxicology - the dose-effect relationship. At this stage, it is necessary to study the quantitative and qualitative characteristics of the reaction of the entire effector apparatus of the biological object to increasing doses of the toxicant, and compare them with the patterns of action of the xenobiotic at the molecular level.
2.2. Basic Concepts
The receptor concept of the action of toxicants on a cell or organ assumes that it is based on the reaction of a substance with a specific biological structure - a receptor (see section "Mechanism of action"). These ideas were most deeply developed in the course of studies on models of interaction of xenobiotics with selective receptors of endogenous bioregulators (neurotransmitters, hormones, etc.). It is in this kind of experiments that the basic patterns underlying the dose-effect relationship were established. It is generally accepted that the process of formation of a complex of a substance with a receptor obeys the law of mass action. However, concepts that allow us to relate the quantitative and qualitative characteristics of this primary reaction and the severity of the effect on the part of the entire biological system remain hypothetical to this day. To overcome the difficulties that arise, it is customary to distinguish two toxicometric characteristics of a xenobiotic:
1. Affinity - reflects the degree of affinity of the toxicant for a given type of receptor;
2. Efficacy - characterizes the ability of substances to cause a certain effect after interaction with the receptor. In this case, xenobiotics that imitate the action of an endogenous bioregulator are called its agonists. Substances that block the action of agonists are called antagonists.
2.3. Affinity
Measuring the affinity of a toxicant for a receptor is essentially an experimental study of the relationship between the amount of a substance added to the incubation medium and the amount of the toxicant-receptor complex formed as a result of interaction. A common methodological technique is radioligand studies (see above).
When using the law of mass action to determine affinity, it is necessary to take into account that the researcher knows the quantitative characteristics of the content in the environment of only one of the participants in the process - the toxicant [P]. The number of [R]T receptors involved in the reaction is always unknown. There are methodological techniques and assumptions that make it possible to overcome this complexity during the experiment and at the analysis stage of processing the results obtained.
2.3.1. Description of the “toxicant-receptor” interaction in accordance with the law of mass action
In the simplest case, the kinetic characteristics of a second-order reaction are used to describe the formation of a complex between a substance and a receptor.
According to the law of mass action:
K D is the dissociation constant of the toxicant-receptor complex.
1/K D - constant of the associative process, is a measure of the affinity of the toxicant to the receptor.
Since the total number of receptors in the system under study (cell culture, isolated organ, etc.) is the sum of free [R] and receptors that interact with the substance, then:
[R]T = + [R] (3)
Taking into account equations (2) and (3), we have
/[R] T = y = [P]/([P] + K D) (4)
The degree of saturation of a receptor with a toxicant “y” is the ratio of the receptor bound to the substance to the total number of receptors. Since the amount of complex formed can be determined experimentally, it becomes possible to calculate the K D value in accordance with equation (4). In a graphical representation, the dependence of receptor saturation on the concentration of a toxicant in the medium has the form of a hyperbola, which can also be used to determine the value of the dissociation constant.
2.3.2. More complex models of toxicant-receptor interactions
Experimentally obtained toxicant binding curves on receptors are often steeper or flatter than expected based on the law of mass action. Sometimes curves are revealed with a complex dependence of the degree of saturation of the receptor with a toxicant on its concentration. These deviations are usually explained by three circumstances:
1. The reaction between the substance and the receptor is not bimolecular. In this case, a different form of specifying the dependence is required than that presented by equation (4):
Y = [P] n /([P] n + K D) (5)
Where n (Heal constant) formally reflects the number of toxicant molecules participating in the formation of one toxicant-receptor complex.
2. The population of the receptor with which the toxicant interacts is heterogeneous. Thus, if a biological object contains two receptor subtypes in equal quantities, differing by 3 times in the value of the association constant of the “toxicant-receptor” complex, then the total value of the Heal constant for the dependence under study will be equal to 0.94. With large differences in the values of the association constants, its integral value will differ to an even greater extent from 1.0.
3. The process of formation of the “toxicant-receptor” complex is influenced to a certain extent by such phenomena as changes in the conformation of the receptor, the cooperativity of its individual subunits, and various allosteric effects. Thus, often the curve of binding of a toxicant to the receptor has an S-shape. This indicates the mutual influence of neighboring sites of toxicant binding to the macromolecule (for example, the formation of a complex with one receptor subunit leads to a change in its affinity for other, free subunits). A similar effect is observed when studying the binding of acetylcholine by a preparation of tissue membranes containing a cholinergic receptor. An increase in the concentration of free [3H]-acetylcholine in the incubation medium is accompanied by an increase in the affinity of the substance for receptor proteins (Figure 1). The local anesthetic prilocaine, when added to the incubation medium, disrupts the phenomenon of receptor cooperativity and, thereby, limits the increase in the affinity of acetylcholine for them. This is evidenced by a change in the shape of the “binding - toxicant concentration” curve and its transformation from S-shaped to conventional hyperbolic.

Figure 1. Effect of prilocaine on the binding of acetylcholine to the cholinergic receptor (J.B. Cohen et al., 1974)
2.4. Efficiency
Numerous experiments have shown that there is not always a direct relationship between the ability of a substance to form a complex with a certain type of receptor and the severity of the resulting biological effect (for example, contraction of smooth muscle fibers of the intestinal wall, change in heart rate, secretion of secretions by the gland, etc.) . A number of theories have been proposed to describe the results of experimental studies in which this dependence was studied.
As stated earlier, all toxicants that interact with the receptor can be conditionally divided into agonists and antagonists. In this regard, below, when indicating the concentration of a toxicant in the environment, the following symbols will be used: [A] - agonist concentration; [B] is the concentration of the antagonist.
2.4.1. Occupation theories
The very first of the proposed theories belonged to Clark (1926), who suggested that the severity of the observed effect is linearly related to the number of receptors occupied by the toxicant (/[R]).
As follows from equation (4)
/[R] T = [A]/([A] + K A) = E A /E M (6)
Where E A is the severity of the effect of the agonist at the applied concentration;
E M - the maximum possible effect from the biological system under study;
K A is the dissociation constant of the agonist-receptor complex.
According to Clark's theory, a 50% effect develops at a dose of agonist at which 50% of the receptors are occupied ([A] 50). This dose of the substance is called moderately effective (ED 50).
Similarly, in accordance with the law of mass action, the antagonist also interacts with the receptor without causing an effect
K V = [V][R]/[VR] (8)
Where K B is the dissociation constant of the receptor-antagonist complex.
If an agonist and antagonist act on a receptor simultaneously, then, naturally, the number of receptors capable of contacting the agonist decreases. The total number of receptors in a biological object can be designated as
[R] T = [R] + + (9)
According to the theory under consideration, a toxicant can be either an agonist or an antagonist. However, the results of numerous studies indicate that such a classification of substances is insufficient to describe the observed effects. It has been established that the maximum effect caused by different agonists acting on the same receptor system is not the same.
To overcome this contradiction, Stephenson (1956) proposed three assumptions:
- the maximum effect can be caused by an agonist even if only a small part of the receptors is occupied;
- the developing effect is not linearly related to the number of occupied receptors;
- toxicants have unequal effectiveness (relative stimulating activity), i.e. the ability to cause an effect by interacting with the receptor. Consequently, substances with different effectiveness, in order to cause the same effect, must occupy different numbers of receptors.
In accordance with these ideas, the strength of the effect depends not only on the number of occupied receptors, but also on the magnitude of a certain stimulus “S”, formed during the formation of the “toxicant-receptor” complex:
E A /E M = (S) = (e/[R] T) = (ey A) (10)
Where e is a dimensionless quantity characterizing the effectiveness of the agonist. According to Stephenson, this is a measure of the ability of a toxicant to cause an effect when forming a complex with a receptor. Stephenson quantitatively determined e = 1, provided that the maximum effect of a substance on a biosystem is 50% of the theoretically possible response of this biosystem to an exciting stimulus.
Furchgott (1964) suggested that the value of “e” directly depends on the total concentration of receptors in the biological system [R]T, and introduced the additional concept of “internal efficiency” of a substance (), the value of which is inversely proportional to the concentration of receptors in the system
E/[R] T (11)
As follows from equation (10)
E A / E M = ([R] T y A) (12)
Substituting expression (6) into equation (12) leads to
E A / E M = (e[A]/([A] + K)) (13)
If the concentration of receptors ready to interact with the agonist decreases by q times (with irreversible blockade of receptors by the antagonist), then the real effectiveness of the substance under study becomes equal to qe, then equation (13) takes the form
E A * /E M * = (qe/( + K)) (14)
This pattern is graphically presented in Figure 2.

Figure 2. The effect of histamine on a preparation of the small intestine of a guinea pig under conditions of increasing blockade of receptors with dibenamine (ED 50 = 0.24 μM; K A = 10 μM; e = 21) (R.F. Furchgott, 1966)
Another concept that allows us to describe the relationship between the effective concentration of a substance and the severity of the developing effect was proposed by Ariens (1954). The author proposes to characterize the substance under study by a value designated as “internal activity” (E)
(E) = E A.MAX /E M (15)
Since the theoretically possible maximum effect can be determined experimentally only when using a strong agonist, usually the E value for most substances lies in the range of 0<
Е
<1.
Для полного агониста Е
= 1, Е
антагониста равна 0.
Thus, the maximum possible biological effect can develop when the toxicant occupies part of the receptors. In this case, irreversible binding of a certain number of receptors should only lead to a shift of the dose-effect curve to the right, without reducing the magnitude of the maximum effect. Only when a certain limit of receptor binding to the antagonist is crossed does the magnitude of the maximum effect begin to decrease.
Typically, in the course of studies of the dose-effect relationship from the standpoint of occupational theories, the following parameters are determined to characterize toxicants:
1. K A - association constant of the agonist-receptor complex (pK A = -lgK A). Since the value of this value is often assessed by an indirect method (i.e., not by the amount of the “toxicant-receptor” complex formed, but by the magnitude of the developed effect when a certain amount of toxicant is added to the environment) based on the concept of “stimuli,” it is better to talk about “apparent” association constant.
2. EC 50 or ED 50 - such concentrations or doses of a toxicant, under the influence of which a response of a biological object is formed equal in intensity to 50% of the maximum possible (pD 2 = -lg ED 50).
3. KB - dissociation constant of the receptor-antagonist complex. The potency of a competitive antagonist can be expressed using only one parameter—receptor affinity. This parameter is assessed with the mandatory addition of an agonist to the incubation medium.
2.4.2. The theory of "speed of interaction"
To explain the data revealed in the process of studying the dose-response relationship, which cannot be understood from the position of occupation theory, Paton (1961) proposed the theory of “speed of interaction”.
Paton suggested that the severity of the response of a biological system to the action of a substance is determined not only by the number of receptors it occupies, but also by the speed with which the substance interacts with the receptor and then disconnects from it. The author used the following comparison: a receptor is not an organ key, on which the longer you press, the longer you extract the sound, but it is a piano key - here the sound is extracted at the moment of impact, and then, even if you hold the key down for a long time, the sound still fades .
According to Paton's theory, strong agonists are substances that quickly occupy and quickly leave the receptor; Antagonists are substances that bind the receptor for a long time.
2.4.3. Theories of receptor conformational changes
For many substances, the dose-response curve deviates significantly from the hyperbolic functional relationship. The Heal coefficient for these curves is not equal to 1 (see above). As already indicated, these features, as well as the S-shaped nature of the dose-effect curves, can sometimes be explained by the phenomenon of cooperative interaction of receptor proteins. It has also been shown that numerous chemical receptor modifiers (for example, dithiothreitol - a reducer of sulfhydryl groups), irreversible blockers of cholinergic receptors (for example, -haloalkylamines), other anticholinergic drugs (atropine), competitive muscle relaxants, local anesthetics and many other substances, change the shape of the dose-effect curve " for agonists, turning it from S-shaped to hyperbolic.
To explain these and other phenomena that are difficult to interpret from the standpoint of occupational theories (sensitization and desensitization of receptors under the action of agonists), Katz and Theslef back in 1957, using the example of studying the action of muscle relaxants, put forward a cyclic (conformational) model of interaction of a toxicant with a receptor.
The model is based on the idea that both the receptor [R] and the toxicant-receptor complex can be in an active (RA, RP A) and inactive state (RI, RP I). This is shown schematically in Figure 3.

Figure 3. Scheme of interaction of a toxicant with a receptor in accordance with the Katz-Theslef model.
This model allows us to explain the effect of agonists and competitive antagonists on the receptor.
An agonist, such as acetylcholine, interacts with RA because it has a higher affinity for RA than for RI, forming the RP A complex. The equilibrium between RP A and RP I is shifted towards RP A, since RI has low affinity for the agonist, and the RP I complex dissociates to form free RI. The development of the effect is formed at the stage of the conformational transformation of RP A to RP I. The intensity of the stimulus arising in a biological system depends on the number of such transformations per unit of time. Competitive antagonists, for example d-tubocurarine, have a greater affinity for R A and reduce the effect of the agonist, turning off some of the receptors from the process of interaction with the latter.
Based on this model, it is practically impossible to experimentally determine the value of the corresponding conversion constants or the intrinsic activity of the agonists. Therefore, to this day, occupation models are still widely used in experiments.
Dose-effect relationship at the body level
3.1. Preliminary remarks
Biological systems for which the dose-effect relationship is studied in toxicology are tissues, organs, and the whole organism. The sensitivity of different organs and body systems to toxicants is not the same. That is why this stage of research is necessary for a detailed characterization of the toxicity of the substance under study.
The study of isolated organs in artificial conditions simulating the natural environment is of great importance for elucidating the mechanisms of interaction between the toxicant and the organism. The theories of the receptor action of toxicants described above are formulated mainly on the basis of data obtained in experiments specifically on isolated organs. It is not surprising that research on these objects still occupies an important place in toxicology.
3.2. Dose-response curve
In general, it can be assumed that the dose-effect curve of an agonist in semi-logarithmic coordinates (logarithm of dose - severity of effect) takes an S-shape, regardless of a number of qualitative and quantitative features of the function being evaluated. The method by which dependence is studied, either the gradual addition of a toxicant to an incubator, or a single action of a substance on a biological object in increasing concentrations, does not have a significant impact on the result if the effect is not assessed in absolute values, but is expressed as a percentage of the maximum possible ( 100%). The use of relative values is advisable, if only because any biological preparation, with the most careful preparation, is unique in all its properties, including sensitivity to chemicals. In addition, during the experiment, the reactivity of the drug decreases. These circumstances require mandatory standardization of the object before research. A graphical representation of the dose-response curve of a toxicant P in comparison with the curve for a certain standard substance provides all the necessary information about the action of P, including its toxicometric characteristics.
Since direct comparison of curves obtained during an experiment is technically difficult, the most important parameters of the curves are often compared.
3.2.1. Average effective dose (IU 50)
The main parameter of the dose-effect relationship for a certain toxicant and biological object is the value of the average effective dose (ED 50), i.e. such a dose of a substance that, when exposed to an object, develops an effect equal to 50% of the maximum possible. When working on isolated organs, an EC value of 50 (the average effective concentration of the substance in the sample) is usually used. Effective doses are usually measured in units of mass of toxicant per unit mass of biological object (for example, mg/kg); effective concentrations are in units of toxicant mass per unit volume of the medium used (for example, g/liter; M/liter). Instead of the value ED 50, its negative logarithm is sometimes used: -log ED 50 = pD 2 (Table 3).
Table 3. pD 2 values for some toxicants obtained in an experiment on an isolated organ (the assessed effect is a reduction in the muscle fibers of the drug) (J.M. Van Rossumm, 1966)
3.2.2. Relative activity
Another parameter of the dose-effect relationship is the relative activity of the toxicant, a value defined as the ratio of the effect caused by the toxicant at a given dose to the maximum possible effect that develops when acting on the biosystem. This characteristic is determined, as mentioned above, by the value of the internal activity of the substance (E).
In the narrow sense of the word, this concept describes the phenomenon of differences in the properties of agonists, taking into account clearly defined ideas about the mechanism of their toxic action. However, at present, it is often interpreted in an expanded sense, as an indicator for comparing the activity of substances with certain properties, without taking into account the mechanisms by which they initiate the observed effect. Figure 4 shows the dose-effect curves of a series of substances that differ in the values of E and, accordingly, ED 50, acting on the parasympathetic part of the autonomic nervous system.

Figure Dose-effect curves of a series of parasympathomimetics (0< Е < 1,0), полученные на препарате изолированной тонкой кишки крысы. (J.M. Van Rossumm, 1966)
3.3. Biological variability
It has already been indicated that a limited number of toxicological experiments can be carried out on the same biological object (in the simplest cases, administer a dose of a substance to an animal; add a substance in increasing concentration to an incubation medium containing an isolated organ, etc.). The search for a dose-effect relationship for one, and even more so, several toxicants requires setting up many experiments, which involves the use of a large number of biological objects. In this regard, the researcher is faced with the phenomenon of biological variability. Even with careful selection, there are objects that are both extremely sensitive and insensitive to the action of chemicals, which leads to a certain variability in the results obtained. It must be borne in mind that the way this phenomenon is taken into account during the analysis of experimental data often affects the final values of the studied characteristics of toxicants.
The basis for taking into account the phenomenon of biological variability is the method of averaging the obtained data. When establishing the value of ED 50, it turns out to be indifferent whether the averaging of doses that cause the same effect on several biological objects, or the values of the effects obtained under the action of certain doses of the toxicant (Figure 5), is carried out. If the task is to obtain the resulting dose-effect curve, then only doses that cause effects of a certain severity on the part of the biological object are subject to averaging. With a different approach (averaging effects), a significant decrease in the steepness of the final dose-effect curve is observed in comparison with the original data.

Figure 5. Construction of an averaged dose-response curve using data obtained on several biological products with different sensitivities to the toxicant under study. Using the method of averaging doses that cause the same effects (A) gives the correct result. The effects averaging method (B) results in a “flattened” resulting curve.
3.4. Combined action of several toxicants on a biological object
When agonists and antagonists act together on a biological object, various modifications of the dose-effect relationship are possible (not associated with various types of chemical and physicochemical interactions of xenobiotics). The most frequently recorded changes are:
- parallel shift of the dose-effect curve;
- reduction of the maximum values of the dose-effect curve;
- parallel shift with a simultaneous decrease in maximum values.
Currently, to explain the observed effects, the concepts of the occupation theory of “toxicant-receptor” interaction are most often used.
3.4.1. Parallel shift of the dose-response curve
The main and most frequently used explanation for the parallel shift of the dose-effect curve for substance (A) with the simultaneous action of substance (B) with internal activity E = 0 on the biological product (introduction into the incubation medium) is based on the assumption that (B) is competitive antagonist (A).
When comparing, on the basis of the occupation theory, equally effective concentrations of the agonist in the absence ([A]) and with the addition of the antagonist ([A*]) at a certain concentration [B], we have
[A*]/[A] = 1 + [V]/K V (16)
Since the coordinates in which the effects are recorded and the parallel shift is observed are semilogarithmic, when taking the logarithm of both sides of equation (16) we have
Log - log[A] = log(1 + [B]/K B) = S (17)
LogK B = log(/[A] - 1) - log[B] (18)
From equation (17) it is clear that the magnitude of the shift of the curve (S) depends only on the concentration of [B] and the value of the dissociation constant of the KB antagonist-receptor complex (Figure 6). The relationship between the magnitude of the stimulus caused by the agonist and the effect on the part of the biosystem does not play any role. Often, the value pA 2 = -logK B is used to characterize the affinity of the antagonist for the receptor.
From equations (16) and (17) it follows that pA 2 is numerically equal to the negative decimal logarithm of the concentration of the competitive antagonist, at which it is necessary to double the content of the agonist in the medium in order to obtain the effect recorded in the absence of the antagonist.

Figure Theoretical dose-response curves for an agonist in the absence (A) and presence (A*) of the antagonist in the incubation medium at a certain concentration [B]. In the example given, the shift S is 1.3 and is defined as S = log - log[A]. Based on the fact that S = log(1 + [B]/K D), K B can be determined experimentally.
3.4.2. Reducing the maximum values of the dose-response curve
In a number of cases, when studying the dose-effect relationship for an agonist (A*) in the presence of an antagonist, it is revealed that the maximum observed effect is significantly weaker than that observed from the action of the same substance in the absence of an antagonist (A). This reduction in the maximum effect, which can be estimated as a percentage, is interpreted from the position of occupation theory as follows.
The non-competitive antagonist (B*) reacts with the receptor (R*) of the biosystem, which is not the R receptor for the agonist (A), and the formation of the complex leads to a decrease in the effectiveness of the complex. This leads to some apparent decrease in intrinsic E agonist activity, dependent on [B*].
The decrease in the maximum values of the dose-response curve can also be explained by irreversible inhibition of the agonist receptor by a competitive antagonist (B).
To quantitatively characterize the activity of a non-competitive antagonist, use the value of the negative logarithm of the dissociation constant of the antagonist-receptor complex
LogK B* = pD* 2
To calculate this value, it is necessary to experimentally determine the maximum possible decrease in the effect of the agonist in the presence of a saturating concentration of the antagonist (E AB*M). Then
PD* 2 = -log - log[(E AB*M - E A)/(E AB* - E A) - 1] (21)
Taking into account (21), pD 2 can be considered as the negative logarithm of the concentration of the non-competitive antagonist, at which the effect of the agonist is reduced by half the maximum achievable level. In this case (E AB*M - E A)/(E AB* - E A) = 2. Usually, to simplify calculations, instead of the E A effect, the maximum effects that develop under the action of A under different conditions are used: E AM, E AMB, E AMVM.
If, with the help of a non-competitive antagonist, it is possible to completely block the effect of the agonist, then the value of pD* 2 can be calculated using a simpler formula
PD* 2 = -log + log(E A /E AB* -1) (22)
3.4.3. Parallel shift with simultaneous reduction of maximum values
In practice, it is extremely rare to encounter substances (antagonists) that cause either only a parallel shift or only a decrease in the maximum values of the dose-effect curve for the agonist. As a rule, both effects are detected. In this regard, it becomes clear that the division of many xenobiotics into groups of competitive and non-competitive antagonists of a number of receptors is largely mechanistic in nature. Nevertheless, in this case there is a need to quantitatively characterize the effect of the substance.
pD 2 is calculated in accordance with equation (22), into which instead of the values of the effects E A and E AB, the values E AM and E AMB are substituted (Figure 7).

Figure Theoretical curves of the dependence of the relative effectiveness of the agonist [A] on its concentration in the presence of the antagonist [B] in the incubation medium. To calculate the value of pD 2, the ratio of conditionally equally effective doses [A] and [A*] should be used, after determining the corresponding E AM and E AMB*. The calculation is carried out in accordance with equation (23), after confirming the fact that the non-competitive antagonist is complete.
3.5. Determination of apparent dissociation constants of the agonist-receptor complex
While a direct connection between the values of pA 2 and pD* 2 antagonists on the one hand and the dissociation constants of the antagonist-receptor complex on the other is recognized at least theoretically, the connection between pD 2 and K A of the agonist is not such in the strict sense. since between the stage of formation of the agonist-receptor complex and the stage of formation of the effect lies a chain of intermediate links of biochemical and physiological reactions, which, as a rule, are far from studied (see above). It follows from this that it is not possible to directly determine the affinity of a toxicant for the receptor (i.e., the value of the dissociation constant of the toxicant-receptor complex) based on the dose-effect relationship built during the experiment. To overcome this difficulty, it is proposed to determine the value of the apparent dissociation constant. The classic method is using an irreversible competitive antagonist.
In 1956, Nickerson discovered that alkylating compounds such as α-haloalkylamines, such as dibenamine and phenoxybenzamine, can interact irreversibly with various types of receptors. Receptors for acetylcholine, histamine, serotonin, and -adrenergic receptors bind. By studying the joint interaction of inhibitors and agonists with biological products, it was possible to:
- establish the specific nature of the action of haloalkylamines on the agonist-binding region of the receptors;
- clarify the classification of receptors in accordance with their affinity for endogenous agonists.
Furchgott proposed a method based on a comparison of equieffective doses of an agonist acting on an intact biological product and a drug pretreated with a receptor inhibitor (a decrease in [R] T by the value q [R] T).
The effect associated with the action of the agonist before receptor blockade is described by equation (13), after blockade - by equation (14). An effect of equal severity under these conditions develops with the same stimulus value S. If S = S*, then E A /E M = E A* /E M*, and then, combining equations 13 and 14, we get
1/[A] = 1/q 1/[A] + (1-q)/qK A (23)
By constructing the dependence in coordinates 1/[A] and 1/[A*], we obtain a straight line with a slope angle of 1/q and a segment on the 1/[A] axis equal to (1-q)/qK A . For practical determination of K A you can use the expression
K A = (slope - 1)/segment
The data preparation process is presented in Figure 8:

Figure Determination of the apparent dissociation constant of agonists on the muscarine-sensitive receptor in the longitudinal muscle of the guinea pig small intestine.
A). Dose-response curve of acetylcholine for the intact drug (q = 1), and the drug treated for 20 minutes with phenokisbenzamine (5 μM) (q = 0.1624).
b). Plotting the ratio of equally effective doses for the intact and treated drug in coordinates 1/[A] and 1/[A*] leads to a straight line, based on which (as well as equation 23) the values of the dissociation constant can be calculated.
Dose-response relationship in the group
4.1. Dose-effect relationship for one toxicant
When studying the dose-response relationship in a group consisting of a large number of individuals, one can proceed from the concepts developed when studying the relationship at the level of an individual organism. An additional factor influencing the results obtained is individual variability.
However, although the reaction of individual people or animals in a group to a toxicant is not the same, as the effective dose increases, the severity of the effect and the number of individuals (individuals) who develop the assessed effect will nevertheless increase. For example, if a substance that causes irritation (irritant) is applied to the skin of test subjects, then as the amount of toxicant applied increases, the following will be observed: - an increase in the number of test subjects who will develop an irritant reaction; - the severity of the phenomenon of irritation in the subjects will increase. It follows from this that the values obtained during the work should be determined taking into account statistical laws.
When studying the effect of a toxicant on the body, one should distinguish between effects, the severity of which depends gradually on the current dose (for example, a decrease in blood pressure) and “all or nothing” type effects (dead/survived). It should be taken into account that effects of the first type can almost always be converted into a form suitable for assessing effects of the second type. To determine the dose-response relationship in a group, they usually resort to two types of experimental design:
- with the formation of subgroups of studied animals;
- without the formation of subgroups.
4.1.1. Analysis of the dose-effect relationship using the method of subgroup formation
The most common way to determine the dose-response relationship of a group is to form subgroups within that group. Animals included in the subgroup are administered the toxicant at the same dose, and in each subsequent subgroup the dose is increased. The formation of subgroups should be carried out using random sampling. As the dose increases, the proportion of animals in each subgroup that develop the assessed effect will increase. The resulting dependence can be represented as a cumulative frequency distribution curve, where the number of animals with a positive reaction to the toxicant (part of the total number of animals in the subgroup) is a function of the dose (Fig. 9)

Figure A typical dose-response curve for a group of animals, symmetrical around the midpoint (50% response). The main values of the group's response to the toxicant are centered around the mean value.
In most cases, the graph is an S-shaped log-normal distribution curve, symmetrical about the midpoint. A number of important characteristics of this curve can be identified, which should be taken into account when interpreting the results obtained.
The center point of the curve (50% response value) or the average effective dose (IU 50) is a convenient way to characterize the toxicity of a substance. If the effect being assessed is the lethality of animals in the group, this point is designated as the average lethal dose (see below). This value is the most accurate quantitative characteristic of toxicity, since the 95% confidence interval is minimal here.
The sensitivity of most animals in the population is close to the average value. The dose interval that includes the main portion of the curve around the center point is sometimes referred to as the "potency" of the drug.
A small portion of the population on the left side of the dose-response curve responds to small doses of the toxicant. This is a group of hypersensitive or hyperreactive individuals. Another part of the population on the right side of the curve responds only to very large doses of the toxicant. These are insensitive, hyporeactive or resistant individuals.
The slope of the dose-response curve, especially near the mean value, characterizes the spread of doses causing the effect. This value indicates how large the change in the population's response to the action of a toxicant will be with a change in the effective dose. A steep slope indicates that most of the population will respond to a toxicant in approximately the same way over a narrow range of doses, while a shallow slope indicates significant differences in the sensitivity of individuals to the toxicant.
The shape of the curve and its extreme points depend on a number of external and internal factors, such as the state of damage repair mechanisms, the reversibility of the effects caused, etc. Thus, the toxic process may not develop until the body’s defense mechanisms from the active toxicant are exhausted and the biochemical detoxification processes become saturated. In the same way, saturation of the processes of formation of toxic metabolites from the original xenobiotic can cause the dose-effect curve to reach a plateau.
An important variant of the dose-response curve is the relationship observed in a genetically heterogeneous group. Thus, in a population with an unusually high number of individuals in whom increased sensitivity to a toxicant is genetically fixed, it is possible to register deviations from the typical S-shape on the left side of the curve (Fig. 10).
 dose
dose
Drawing 10. Variant of the cumulative dose-effect curve with a pronounced hyperreactive component
The dose-response curve is often converted into a linear relationship by plotting it in log-probit coordinates (the dose of a toxicant is represented in logarithms, the severity of the response in probits). This transformation allows the researcher to subject the results to mathematical analysis (for example, to calculate a confidence interval, slope, etc.) (Fig. 11).

Drawing 11. Transformation of experimental data for determining the "DOSE - EFFECT" relationship: a) "EFFECT - DOSE" relationship; b) dependence "EFFECT - log DOSE"; c) dependence "PROBIT EFFECT - log DOSE".
Using the method of forming subgroups, it is possible to determine the dependence of the severity of the assessed effect (for example, the degree of drop in blood pressure, decrease in physical activity, etc.) on the current dose of the toxicant. In this case, based on the data obtained, the average magnitude of the effect that developed in the subgroup of subjects on the substance at the administered dose is determined, and the confidence interval of the indicator is determined at each point. Then a graph of the dependence of the magnitude of the effect on the administered dose is constructed by finding an approximation curve through a “cloud” of points (Figure 12).

Drawing 12. Dose-response curve for assessing the anesthetic effect of the neuroleptic pimozide when administered intraperitoneally to rats. Each point on the graph was obtained by recording the effects obtained in 10 - 20 animals.
4.1.2. Analysis of the dose-response relationship without forming subgroups
When studying the effect of substances that are rapidly distributed but slowly excreted from the body, it is possible to ensure their gradual intravenous administration to a laboratory animal until the onset of a toxic effect that is quite definite in severity (for example, a decrease in respiratory rate by 40%). Thus, it becomes possible for each individual organism to determine the dose of a substance that causes the desired effect. The study is carried out on a fairly large group of animals. If we plot the dependence of the number of animals in which the effect has developed on the magnitude of the doses used, we will obtain the already well-known S-shaped curve, the analysis of which is carried out according to general rules.
4.1.3. Dose-effect relationship for mortality
4.1.3.1. General views
Since death after exposure to a toxicant is an alternative reaction implemented on the “all or nothing” principle, this effect is considered the most convenient for determining the toxicity of substances; it is used to determine the value of the average lethal dose (LD 50).
Determination of acute toxicity by the “mortality” indicator is carried out using the method of forming subgroups (see above). The toxicant is administered in one of the possible ways (enterally, parenterally) under controlled conditions. It must be taken into account that the method of administration of the substance most significantly affects the magnitude of toxicity (Table 4).
Table 4. Effect of route of administration on the toxicity of sarin and atropine to laboratory animals
Animals of the same sex, age, weight, kept on a specific diet, under the necessary housing conditions, temperature, humidity, etc. are used. The studies are repeated on several types of laboratory animals. After administration of the test chemical compound, observations are made to determine the number of dead animals, usually over a period of 14 days. In the case of applying a substance to the skin, it is absolutely necessary to record the time of contact, as well as specify the conditions of application (exposure was carried out from a closed or open space). It is obvious that the degree of skin damage and the severity of the resorptive effect are a function of both the amount of material applied and the duration of its contact with the skin. For all routes of exposure other than inhalation, the exposure dose is usually expressed as the mass (or volume) of the test substance per unit body mass (mg/kg; ml/kg).
For inhalation exposure, the exposure dose is expressed as the amount of the test substance present in a unit volume of air: mg/m3 or parts per million (ppm). With this method of exposure, it is very important to consider the exposure time. The longer the exposure, the higher the exposure dose, the higher the potential for adverse effects. The information obtained about the dose-response relationship for different concentrations of a substance in inhaled air should be obtained at the same exposure time. The experiment can be structured differently, namely, different groups of experimental animals inhale the substance at the same concentration, but for different times.
For an approximate assessment of the toxicity of inhalation active substances, which simultaneously takes into account both the concentration of the toxicant and the time of its exposure, it is customary to use the “toxodose” value, calculated according to the formula proposed by Haber at the beginning of the century:
W = Ct, where
W - toxodose (mg min/m 3)
C - toxicant concentration (mg/m 3)
t - exposure time (min)
It is assumed that with short-term inhalation of substances, the same effect (death of laboratory animals) will be achieved both with short exposure to high doses and longer exposure to substances in lower concentrations, while the product of time and concentration for the substance remains unchanged. Most often, the definition of toxodosis of substances was used to characterize chemical warfare agents. The toxicity values of some chemical agents are presented in Table 5.
Table 5. Toxodeses of toxic substances (with inhalation exposure)
(M. Kruger, 1991)
The dose-lethality curve is usually similar in shape to the cumulative frequency distribution curve for other dose-response relationships (see above). For the purpose of comparing the obtained data and statistical processing, the curve is converted into the form of a linear dependence using the “log D - probit” coordinate system.
Toxicity in terms of lethality is usually determined by a certain level of death of animals in the group. The most commonly used reference level is 50% animal mortality, as this corresponds to the median of the dose distribution curve around which most positive responses are symmetrically concentrated (see above). This value is called the average lethal dose (concentration). By definition, a substance acting at this dose causes the death of half the animal population.
The concept of determining the LD 50 of substances was first formulated by Trevan in 1927. From this moment, the formation of toxicology begins as a real science, operating with the quantitative characteristics of the property being studied (toxicity value).
As other mortality levels to be determined, the values of LD 5 and LD 95 can be selected, which, according to the laws of statistics, are close, respectively, to the threshold and maximum of the toxic effect and are the boundaries of the dose interval within which the effect is mainly realized.
For ethical and economic reasons, they try to use a minimum number of laboratory animals in the experiment to determine LD 50. In this regard, the determination of the desired value is always associated with an uncertainty factor. This uncertainty is taken into account by finding the 95% confidence interval of the determined value. Doses falling within this interval are not moderately lethal only with a probability of less than 5%. The confidence interval for the LD50 value is significantly smaller than the confidence intervals for doses of other lethality levels, which is an additional argument in favor of this particular characteristic of acute toxicity parameters.
As already indicated, an important characteristic of any dose-response curve is its steepness. Thus, if two substances have statistically indistinguishable LD 50 values and the same steepness of the dose-effect toxicity curve (i.e., statistically indistinguishable LD 16 and LD 84 values, respectively), they, in terms of lethality, are equitoxic in a wide range dose range (substances A and B in Fig. 13). However, substances with similar LD50 values, but different slopes of the toxicity curve, differ significantly in their toxic properties (substance C in Fig. 13).

Drawing 13. Dose-effect relationships of toxicants with similar LD50 values, but different slopes
Substances with a flat dose-effect relationship pose a great danger to persons with severe hypersensitivity to toxicants. Substances with a high degree of dependence are more dangerous for the entire population, since even a slight increase in dose compared to the minimum effective one leads to the development of an effect in the majority of the population.
4.1.3.2. Determination of safe doses of toxicants
In some cases, there is a need to quantify the value of the maximum non-active (safe) dose of toxicants.
A method for solving this problem was proposed by Goddam. The study is based on establishing the dose-effect relationship in a group of animals. It is desirable that the effect being assessed is sufficiently sensitive and not assessed in an alternative form (for example, a decrease in enzyme activity, an increase in blood pressure, a slowdown in growth, impaired hematopoiesis, etc.). The dependence graph is plotted in the coordinates “logarithm of the dose - severity of the effect.” Curve analysis allows you to evaluate a number of indicators. Since the curve, as a rule, has an S-shape, a section is isolated within which the dependence is linear. Determine the steepness of the straight line (b). The threshold effect (y S) is determined by the formula: y S = tS, where t is the Student coefficient determined from the corresponding tables; S is the standard deviation value determined from the wholesale data. Threshold dose (D S) is the dose at which a substance causes a threshold effect. For a safe dose (D I) we have
Log D I = log D S - 6(S/b)
Example shown in Figure 14
Ecotoxicometry – a section of ecotoxicology that examines methodological techniques that allow one to assess (prospectively or retrospectively) the ecotoxicity of xenobiotics.
All types of classical quantitative toxicological studies are fully used to determine the ecotoxicity of xenobiotics.
The acute toxicity of ecopollutants is determined experimentally on several species that are representatives of different levels of trophic organization in the ecosystem (algae, plants, invertebrates, fish, birds, mammals). When establishing criteria for the quality of water containing a certain toxicant, the US Environmental Protection Agency requires that its toxicity be determined on at least 8 different species of freshwater and marine organisms (16 tests).
Repeated attempts have been made to rank species of living beings according to their sensitivity to xenobiotics. However, for different toxicants the ratio of sensitivity of living beings to them is different. Moreover, the use in ecotoxicology of “standard species” of representatives of certain levels of ecological organization to determine the ecotoxicity of xenobiotics is scientifically incorrect, since the sensitivity of animals, even closely related species, sometimes differs very significantly.
Dose-effect relationship (epidemiological approach). The spectrum of manifestations of the toxic process is determined by the structure of the toxicant. However, the severity of the resulting effect is a function of the amount of active agent. Toxic substances, biological substances, penetrating radiation and other damaging factors can be considered as harmful agents. A wide variety of characteristics can be taken into account as effects. For example, death, an indicator going beyond the biological norm, etc. To denote the amount of a substance acting on a biological object, the concept is used - dose (acting dose). The type of damaging agent and the route of delivery of the influencing dose can be very diverse. The impact dose can be directly measured using technical means and expressed in appropriate units (mg/kg, mg/m3, gray, cells/kg, etc.). For example, the injection of a toxicant in an amount of 500 mg into the stomach of a rat weighing 250 g and a rabbit weighing 2000 g means that the animals were given doses equal to 2 and 0.25 mg/kg, respectively. The exposure dose has a normal distribution and is characterized by the average value and dispersion due to the error of its measurement. The dose-effect relationship can be traced at all levels of organization of living matter: from molecular to population. In this case, in the overwhelming majority of cases, a general pattern will be recorded: with increasing dose, the degree of damage to the system increases; An increasing number of its constituent elements are involved in the process. Depending on the effective dose, almost any substance under certain conditions can be harmful to the body.
The manifestation of the dose-effect relationship is significantly influenced by intra- and interspecific variability of organisms. Indeed, individuals belonging to the same species differ significantly from each other in biochemical, physiological, and morphological characteristics. These differences are in most cases due to their genetic characteristics. Due to the same genetic characteristics, interspecific differences are even more pronounced. In this regard, the doses of a particular substance in which it causes damage to organisms of the same and, especially, different species, sometimes differ very significantly. Consequently, the dose-effect relationship reflects the properties of not only the toxicant, but also the organism on which it acts. In practice, this means that a quantitative assessment of toxicity, based on the study of the dose-effect relationship, should be carried out in experiments on various biological objects and it is necessary to resort to statistical methods for processing the data obtained.
The dose-effect relationship should not be confused with the dose-response relationship; the latter determines the degree of change in the selected indicator compared to the norm. The response can be measured either in absolute units or in relative units (percentages).
When establishing any critical level of a norm (control) indicator and calculating the frequency of its excess in an experimental sample, the dose-response relationship turns into a dose-effect relationship or an efficiency function for a given criterion. The efficiency function consists of a collection of points. Each point is formed due to the existence of individual characteristics in the test objects (individual sensitivity), which ultimately leads to either the appearance of a registered sign or its absence when exposed to a given dose of the factor under study.
The most common way to determine the dose-response relationship of a group is to form subgroups within that group. Animals included in the subgroup are administered the toxicant in the same dose, and in each subsequent subgroup the dose is increased. The formation of subgroups should be carried out using random sampling. As the dose increases, the proportion of animals in each subgroup that develop the assessed effect will increase. The resulting dependence can be represented in the form of a cumulative frequency distribution curve, where the number of animals with a positive reaction to the toxicant (part of the total number of animals in the subgroup) is a function of the dose (Fig. 2).
Rice. 2. Typical dose-response curve for a group of animals,
symmetrical about the midpoint (50% answer). Basic
group response values to a toxicant are centered around
average value
In most cases, the graph is an S-shaped log-normal distribution curve, symmetrical about the midpoint. A number of important characteristics of this curve can be identified, which should be taken into account when interpreting the results obtained.
1. Center point of the curve (50% response value) or average effective dose(ED 50) is a calculated statistical value, which also has a normal distribution and is characterized by a mean and variance. The effective dose is calculated from the effect probabilities, and its variance includes both the effect dose error and the effect error. The effective dose at each point of the function is designated by a certain category corresponding to the probability of the effect. If the effect being assessed is the lethality of animals in the group, this point is designated as the mean lethal dose. The set of effective doses actually constitutes the effectiveness function.
2. The sensitivity of most animals in the population is close to the average value. The dose interval that includes the main portion of the curve around a central point is sometimes referred to as the "potency" of the drug.
3. A small portion of the population on the left side of the dose-response curve responds to small doses of the toxicant. This is a group of hypersensitive or hyperreactive individuals. Another part of the population on the right side of the curve responds only to very large doses of the toxicant. These are insensitive, hyporeactive or resistant individuals.
4. The slope of the dose-response curve, especially near the mean value, characterizes the spread of doses causing the effect. This value indicates how large the change in the population's response to the action of a toxicant will be with a change in the effective dose. A steep slope indicates that most of the population will respond to a toxicant in approximately the same way over a narrow range of doses, while a shallow slope indicates significant differences in the sensitivity of individuals to the toxicant.
The shape of the curve and its extreme points depend on a number of external and internal factors, such as the state of damage repair mechanisms, the reversibility of the effects caused, etc. Thus, the toxic process may not develop until the body’s defense mechanisms from the active toxicant are exhausted and the biochemical detoxification processes become saturated. In the same way, saturation of the processes of formation of toxic metabolites from the original xenobiotic can cause the dose-effect curve to reach a plateau.
Traditionally, in toxicology, there has been a natural belief that as the dose of poison increases, the probability of the expected effect should increase, approaching one. This is exactly how the toxic effect of the vast majority of harmful substances and poisons manifests itself on living organisms. More on this matterA.Albert (1958) noted (According to: S.V. Krishtopenko et al., 2001): “Should anyone expect a decrease in the toxic effect of any biologically active substance as the concentration increases? However, a few examples show where this happens." In certain test dose ranges, the dose-effect relationship takes on a nonlinear form and is completely incapable of mathematical analysis using traditional methods.
According to the information given in the work of M.G. Domschlag (1998), based on the results of environmental studies, a nonlinear (bimodal, inverted,V-shaped, including segments with superlinearity, sublinearity and linearity) dependence “concentration (dose) - effect” under the influence of chemical mutagens, toxic compounds and low-intensity irradiation (According to: S.V. Krishtopenko et al., 2001).
This phenomenon is called in toxicology "paradoxical toxicity". It is believed that its origin is due to the simultaneous implementation of various mechanisms of toxicity and manifestations of the body’s protective reactions (for example, detoxification harmful substances). In this sense, there is nothing unusual (paradoxical) in the toxodynamics of such agents. In some cases, the mechanisms for realizing these effects are unknown. The term “paradoxical toxicity” itself should be understood as the phenomenon of a decrease in the probability of manifestation of a registered symptom (effect) in an experimental sample of test objects with a consistent increase in doses of harmful agents.
The term “paradoxical toxicity” is used to characterize toxicants. In this case, if other indicators are used as a registered sign, then the “dose-effect” relationship is defined by the general term “paradoxical effectiveness”.
The paradoxical effectiveness function is a special case of the dose-effect relationship. In a two-dimensional coordinate system, at each point it reflects the probability of the occurrence of a recorded sign when exposed to the tested dose. The tested doses are recorded on the abscissa axis, and the probabilities (frequencies) of effects after exposure to these doses are recorded on the ordinate axis. The characteristic is taken into account in an alternative form (1 – there is a manifestation of the characteristic, 0 – there is no manifestation of the characteristic) using the terms “frequency” and “probability” of the effect.
Effect frequency- this is a relative value, expressed in fractions of a unit or as a percentage and found experimentally by relating the number of test objects that showed the indicated sign to the total number of test objects in the experimental group.
Probability of effect is called a predicted relative value, calculated using statistical methods and also expressed in relative units or as a percentage. For example, to convert the frequency values of effects into probability values, the Van den Weerden formula is used:
P= n+1/N+2,
Wheren– number of objects in the selected group,
N– the total number of objects in the studied sample of animals.
The quantitative value of the frequency of the effect characterizes the probability of occurrence in the experimental sample of test objects of individuals with pronounced sensitivity to a given dose of the test agent. It is for this category of test objects that the specified characteristics are recorded. As the dose increases, the ratio of sensitive test objects in new experimental samples may change, which is the reason for the formation of the type of efficiency function. With a uniform increase in the number of sensitive test objects with increasing doses, a linear efficiency function is formed. Otherwise, the type of efficiency function can be very different, including decreasing with increasing doses, that is, paradoxical.
In modern toxicometry, the problem of assessing the phenomenon of paradoxical toxicity is that to date no adequate mathematical model has been developed on the basis of which it would be possible to plan an experiment and process the data obtained, proving the presence or absence of paradoxical effects. Classical methods for constructing an efficiency function and determining categories of effective doses are unsuitable if the efficiency function differs from the normal distribution function.
Dose-effect relationship in terms of mortality. Since death after the action of a toxicant is an alternative reaction, implemented according to the “all or nothing” principle, this effect is considered the most convenient for determining the toxicity of substances; it is used to determine the value mean lethal dose (LD 5 0 (LD 50)). Average lethal dose (or concentrationLC 50) – the amount of poison that causes the death of 50% of a standard group of experimental animals at a certain period of follow-up.
Determination of acute toxicity by the “mortality” indicator is carried out using the method of forming subgroups. The toxicant is administered in one of the possible ways (for example, for rats, mice - enterally, parenterally) under controlled conditions.
It is necessary to take into account that the method of administration of the substance most significantly affects the magnitude of toxicity (Table 3).
Table 3
Effect of route of administration on the toxicity of sarin and atropine
for laboratory animals (According to: S.A. Kutsenko, 2002)
|
Toxicant |
Animal |
Method of administration |
Lethal dose (mg/kg) |
|
Sarin |
Subcutaneously |
0,12 |
|
|
Atropine |
Intravenously |
Animals of the same sex, age, weight, kept on a specific diet, under the necessary housing conditions, temperature, humidity, etc. are used. The studies are repeated on several types of laboratory animals. After administration of the test chemical compound, observations are made to determine the number of dead animals, usually over 14 days.
The dose-lethality curve is usually similar in shape to the cumulative frequency distribution curve for other dose-response relationships. For the purpose of comparing the obtained data and statistical processing, the curve is converted into the form of a linear dependence.
Toxicity in terms of “lethality” is usually established by a certain level of death of animals in the group. Most often, 50% animal mortality is used as a control level, since this corresponds to the median of the dose distribution curve, around which the majority of positive responses are symmetrically concentrated.
The concept of determining the LD 50 of substances was first formulated by Trevan in 1927. From this moment, the formation of toxicology begins as a real science, operating with the quantitative characteristics of the property being studied (toxicity value). As other mortality levels to be determined, the values of LD 5 and LD 95 can be selected, which, according to the laws of statistics, are close, respectively, to the threshold and maximum of the toxic effect and are the boundaries of the dose interval within which the effect is mainly realized.
As already indicated, an important characteristic of any dose-response curve is its steepness. Thus, if two substances have statistically indistinguishable LD 50 values and the same steepness of the dose-effect toxicity curve (i.e., statistically indistinguishable LD 16 and LD 84 values, respectively), they are equitoxic in terms of lethality over a wide range of doses (substances A and B in Fig. 3). However, substances that have similar LD50 values, but different slopes of the toxicity curve, differ significantly in their toxic properties (substance C in Fig. 3).

Rice..
Dose-effect relationships of toxicants with similar values
LD 50 values, but with different slopes
In addition to lethal doses, ecotoxicometry also distinguishes threshold doses:
RSt 10 – for inhalation poisoning;
PD 10 (PD 10) – for other types of exposure,
where the index indicates the appearance of signs of poisoning.
A-priory, Harmful effect threshold – minimum concentration (dose) of a substance in an object environment, under the influence of which in the body (under specific conditions of intake of the substance and a standard statistical group of animals) changes occur that go beyond the limits of physiological adaptive reactions, or hidden (temporarily compensated) pathology. The single action threshold is indicated by the symbol Lim(ac), the chronic action threshold is indicated by the symbol Lim(ch).
When assessing ecotoxicity, it is necessary to take into account that although almost all substances can cause acute toxic effects, chronic toxicity is not detected in every compound. An indirect value indicating the degree of danger of a substance during its chronic action is the ratio of concentrations causing acute and chronic effects. If this ratio is less than 10, the substance is considered to be of low risk for chronic exposure.
When assessing the chronic ecotoxicity of a substance, the following circumstances must be taken into account:
1. Determining the hazard coefficient is only the very first step in determining the ecotoxic potential of a substance. In laboratory conditions, threshold concentrations of the chronic effects of toxicants are determined by assessing the mortality, growth, and reproductive abilities of the group. Studying other effects of chronic exposure to substances can sometimes lead to different numerical characteristics.
2. Toxicity studies are carried out on animals suitable for laboratory conditions. The results obtained cannot be considered as absolute. Toxicants may cause chronic effects in some species but not in others.
3. The interaction of a toxicant with biotic and abiotic elements of the environment can significantly affect its toxicity in natural conditions.
The population nature of the dose-effect relationship (According to: V.S. Bezel et al., 1994). Environmental toxicology operates with a mandatory supraorganismal rank of indicators.
There must be a certain critical number of individuals in a population, below which its existence in natural conditions is impossible. This critical situation corresponds to a certain percentage of “affected individuals.”
The problem of estimating the range of effective doses for biological systems of various ranks is complex and inextricably linked with the concept of norm.
The theory of norms as applied to biological systems is currently insufficiently developed.
In the process of evolutionary development, plant and animal organisms have acquired the ability to adequately respond to changes in the environment caused by changes in natural and climatic factors. Biological systems of various ranks are evolutionarily unprepared for the effects of anthropogenic factors, including technogenic pollution. Their reaction to the technogenic process is nonspecific within the framework of traditional, evolutionarily fixed compensation mechanisms. Only in this case can the adaptive capabilities be exceeded and the parameters characterizing the functioning of biological systems can go beyond the permissible limits.
The most characteristic indicator of the norm of biological systems is the ability to change their functional parameters in changing conditions of existence in order to maintain the system in optimal conditions. In other words, the norm of the whole is the norm of interaction of its parts in the process of adapting the system to the conditions of existence.
A population as a system of interconnected individuals, already due to the initial heterogeneity of its individual ecological-functional groups, is characterized by the diversity of their response to any external influence. There is a kind of reserve of hereditarily fixed intraspecific variability, which, on the one hand, manifests itself in a wide range of individual subpopulation groups in response to technogenic environmental pollution, and on the other hand, is due to the presence of specific population mechanisms for compensating for unfavorable changes in the structure and function of the population caused by pollution. This reserve is a necessary component of the population's normal reaction to technogenic environmental pollution.
In connection with the above, the population nature of the dose-effect relationship should take into account the following circumstances.
1. Quantitative assessment of the “dose” involves taking into account the measure of toxic impact, reflecting not just the average levels of toxic substances in environmental objects, but the specificity of the population as a heterogeneous object, the elements of which experience toxic effects of varying intensity. For example, this could be the total content or flow of toxicants, divided into individual components corresponding to the population structure.
2. In a similar way, the assessment of the effect should include some integral indicators of the state of the population, directly controlling the stability of its structure and function. For example, indicators of fertility or fruiting, survival, productivity, area occupied or numbers, etc.
3. When assessing the effects of the supraorganismal level, it is necessary to proceed from the primary manifestations of toxicity at the molecular, tissue, cellular and organismal levels.
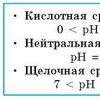
4. The role of environmental factors in the implementation of population-level effects is greater than for other systems. For example, the influence of environmental pH upon the impact of pollution on communities of aquatic organisms.
An analysis of a large amount of factual material convinces that the observed manifestations of toxicity when exposed to almost all technogenic pollutants clearly correlate with the accumulation of these substances in individual components of the biota.
Thus, technogenic substances that pollute natural ecosystems are included in the biological cycle due to the vital activity of plant and animal populations. At the same time, populations, being systems of interconnected heterotrophic groups of individuals, modify these flows in accordance with their ecological and functional specificity, thereby determining the heterogeneity of accumulated levels of toxicants and responses to exposure.
For example, we caught all the animals of one species in a certain contaminated area. The levels of pollutants in these animals can vary significantly. Such differences are due to several reasons.
First of all, these may be differences in the intensity of metabolic processes in individual individuals or their belonging to different ecological and functional groups in the population (mature and immature individuals, underyearlings and overwintered ones, etc.). It is possible that the sample may contain animals migrating from less contaminated areas.
In any case, along with the majority of animals characterized by certain average levels of pollutants, individuals with maximum and minimum levels of toxicants will always be present in the sample.
Naturally, the measure of toxic effects, what is understood as a dose, cannot be characterized by certain average values of the content of toxic elements in the biota. Such a measure should reflect the variability of the metabolic processes of individual organisms, leading to variability in the levels of toxicants they accumulate in homogeneous groups, and also take into account the different quality of individual subpopulation groups in this indicator.
The distribution of levels of toxic elements among animals in a sample can be expressed mathematically by one of the laws of statistical distribution.
Some integral function should be considered as a population measure of toxic effects ƒ( x), describing the statistical distribution of the contents of toxic elements in organisms that make up a population or a certain population sample (concentration spectrum). Herex– the content of a substance in the internal environments of the body (for example, the concentration of heavy metals in the blood). The entered indicator is a population characteristic. On the one hand, it reflects the specificity of the accumulation of toxic substances at the organismal level, its dependence on individual genetic and functional variability of metabolic processes and energy needs of organisms belonging to homogeneous population groups. On the other hand, this indicator is not a simple sum of pollution levels.
Changing conditions of existence of natural populations, including the influence of technogenic pollution, directly affect the abundance or numbers of individual ecological and functional groups (seasonal, spatial, sexual, age, etc.). This determines the contribution of each intrapopulation group to the overall distribution of levels of toxic elements in populations and allows such distributions to be considered as a measure of toxic exposure.
The statistical distribution of concentrations of toxic substances in tissues or organisms as a whole is asymmetrical (cannot be described by the law of normal distribution). In environmental toxicology, as an argument for the dose-effect relationship, one should consider the spectrum of concentrations of toxic substances in a population sample, described by a lognormal distribution law.
The transition to the population form of the “dose-effect” relationship involves considering the function “distribution of the contents of toxic elements in the organisms that make up the population” - the proportion of “affected” individuals in it.
The difficulty of transitioning to the analysis of dose dependencies of ecological systems at the supraorganism level is associated with the practical impracticability of active experiments with dosed loads on natural biogeocenoses. Another difficulty relates to the uncertainty of the dose of toxic load in a real-life situation. Emissions from real sources of pollution, as a rule, are multicomponent, and it is not always possible to isolate one or two leading toxicants. Finally, the third difficulty in analyzing dose-effect relationships at the ecosystem level is associated with the significantly greater spatiotemporal variability of parameters compared to other levels of organization. It is determined both by the natural mosaic of environmental factors and by the spatial heterogeneity of the distribution of the toxic load dose.
Dose-response curve
Dose-response curves for ligands with different activities generated according to the Hill equation. Full and partial agonists have different values of ED50, Emax and Hill coefficient (determines the slope of the curve).
Dose-response curve(or concentration-effect) describes the change in the influence of some ligand on a biological object depending on the concentration of this ligand. Such a curve can be constructed for individual cells or organisms (when small doses or concentrations cause a weak effect, and large ones - a strong one: graduated curve) or populations (in this case, it is calculated in which percentage of individuals a certain concentration or dose of the ligand causes an effect: corpuscular curve ).
The study of dose-response relationships and the construction of appropriate models is a fundamental element for determining the range of therapeutic and safe doses and/or concentrations of drugs or other chemicals encountered by a person or other biological entity.
The main parameters that are determined when constructing models are the maximum possible effect (E max) and the dose (concentration) that causes the half-maximal effect (ED 50 and EC 50, respectively).
When conducting this type of research, it must be borne in mind that the form of the dose-effect relationship usually depends on the time of exposure of the biological object to the action of the test substance (inhalation, ingestion with food, contact with the skin, etc.), therefore, quantitative assessment of the effect in In the case of different exposure times and different routes of entry of the ligand into the body, it most often leads to different results. Thus, in an experimental study, these parameters should be unified.
Curve Properties
A dose-response curve is a two-dimensional graph showing the dependence of the response of a biological object on the magnitude of the stress factor (concentration of a toxic substance or pollutant, temperature, radiation intensity, etc..). By "response" the researcher may mean a physiological or biochemical process, or even a mortality rate; therefore, the units of measurement may be numbers of individuals (in the case of mortality), ordered descriptive categories (e.g., extent of damage), or physical or chemical units (blood pressure value, enzyme activity). Typically, a clinical trial examines several effects at different organizational levels of the research object (cellular, tissue, organismal, population).
When constructing a curve, the dose of the test substance or its concentration (usually in milligrams or grams per kilogram of body weight, or in milligrams per cubic meter of air when administered by inhalation) is usually plotted on the x-axis, and the magnitude of the effect is on the y-axis. In some cases (usually with a large dose interval between the minimum effect that can be registered and the maximum possible effect), a logarithmic scale is used on the y-axis (this construction option is also called “semi-logarithmic coordinates”). Most often, the dose-response curve has a sigmoid shape and is described by the Hill equation, which is especially evident in semi-logarithmic coordinates.
Statistical curve analysis is usually performed by statistical regression methods such as probit analysis, logit analysis, or the Spearman-Kerber method. At the same time, models that use nonlinear approximation are usually preferred over linear or linearized ones, even if the empirical dependence looks linear over the studied interval: this is done based on the fact that in the vast majority of dose-response relationships, the mechanisms of development of the effect are nonlinear, but the distribution experimental data may appear linear under some specific circumstances and/or certain dose intervals.
Also, a fairly common technique for analyzing the dose-effect curve is its approximation by the Hill equation to determine the degree of cooperativity of the effect.
Notes
Wikimedia Foundation.
2010.
See what a “Dose-Effect Curve” is in other dictionaries: Dose-response curve
- * “dose effect” covering * dose effect curve graphic curve showing the relationship when exposed to radiation between the biological effect and the radiation dose... Dose-response curve - * “dose adcas” covering * dose response curve in radiobiology a graphic curve reflecting the linear dependence of the logarithm of the survival rate on the radiation dose (see “Dose effect” curve. Target theory. Multiple events curve) ...
Genetics. encyclopedic Dictionary
Figure 1. Molecular structure of the AMPA receptor embedded in the cell membrane and the binding of the AMPA receptor ligand to it (α amino 3 hydroxy 5 methyl 4 isoxazolepropionic acid receptor, AMPAR ... Wikipedia
Typical sigmoid "concentration effect" curve. The ligand concentration is plotted on the horizontal axis, the ratio of the recorded effect to the maximum possible is plotted on the vertical axis. The EC50 value coincides with the inflection point of the curve. EC50... ... Wikipedia
See also: Alcohol intoxication The request “Alcohol poisoning” is redirected here. A separate article is needed on this topic. Ethanol is a substance that combines the properties of a natural metabolite of the human body (in small concentrations), ... ... Wikipedia PHOTOTHERAPY
- (phototherapy, from Greek phos, photos light and therapeia care, treatment). Modern S. is based on familiarity with the so-called. chem. action of light. First of all, the effect of sieve on bacteria was studied. In 1877 Downes and Blent (Downes,... ...- STOMACH. (gaster, ventriculus), an expanded section of the intestine, which, due to the presence of special glands, has the significance of a particularly important digestive organ. Clearly differentiated “stomachs” of many invertebrates, especially arthropods and... ... Great Medical Encyclopedia
MALARIA- MALARIA, from the Italian malaria, spoiled air, intermittent, intermittent, swamp fever (malaria, febris intermittens, French paludisme). Under this name, a group of closely related people is united... ... Great Medical Encyclopedia
RHEUMATISM ACUTE- ACUTE RHEUMATISM. Contents: Geographical distribution and statistics. 460 Etiology and pathogenesis......... 470 Pathological anatomy............... 478 Symptoms and course......... ....... 484 Prognosis...................... 515 Diagnosis ... Great Medical Encyclopedia
Cisordinol Zuclopenthixol is an antipsychotic drug (antipsychotic), a thioxanthene derivative. Contents... Wikipedia
The dose-effect relationship can be traced at all levels of organization of living matter: from molecular to population. In this case, in the overwhelming majority of cases, a general pattern will be recorded: with increasing dose, the degree of damage to the system increases; An increasing number of its constituent elements are involved in the process.
Depending on the effective dose, almost any substance under certain conditions can be harmful to the body. This is true for toxicants acting both locally (Table 8.1) and after resorption into internal environments (Table 8.2).
Table 8.1
The relationship between the concentration of formaldehyde in the inhaled air and the severity of the toxic process ((P.M. Misiak, J.N. Miceli, 1986))
Table 8.2
The relationship between the concentration of ethanol in the blood and the severity of the toxic process ((T.G. Tong, D. Pharm, 1982))
The manifestation of the dose-effect relationship is significantly influenced by intra- and interspecific variability of organisms. Indeed, individuals belonging to the same species differ significantly from each other in biochemical, physiological, and morphological characteristics. These differences are in most cases due to their genetic characteristics. Due to the same genetic characteristics, interspecific differences are even more pronounced. In this regard, the doses of a particular substance in which it causes damage to organisms of the same and, especially, different species, sometimes differ very significantly. Consequently, the dose-effect relationship reflects the properties of not only the toxicant, but also the organism on which it acts. In practice, this means that a quantitative assessment of toxicity, based on the study of the dose-effect relationship, should be carried out in experiments on various biological objects, and it is necessary to resort to statistical methods for processing the data obtained.
The dose-effect curve (more precisely, the dependence of biological consequences on the level of exposure) is strictly individual for each substance-biological object pair (see Fig. 8.2).
Rice. 8.2. Typical dose-effect curves for substances a, b, c (according to A. A. Golubev et al.)
In Fig. Typical types of such curves are presented. In the majority
In some cases they are S-shaped curves, and in some cases they are expressed as a hyperbola, exponential or parabola.
These curves reflect the complex nature of the interaction of a harmful substance with an object, the qualitative and quantitative features of such interaction in each specific case. There are various sections of the dose-response curve where small changes in the concentration (dose) of a substance cause either a significant increase in the effect of exposure or lead to only a slight change in the effect.
From Fig. It can be seen that if substances a, b, c are arranged in order of increasing effect of their influence, then in different zones of the “dose-effect” curve this order will be different. So, in zone I - a > b > c, in zone II - b > a > c, in zone III - b > c > a and in zone IV - c > b > a. Thus, it is clear that if the toxicity of a substance is assessed by the dose that causes a certain percentage of death in animals, then the result of a comparative analysis of the toxicity of substances may be different, depending on in which zone of the dose-effect curve this analysis is carried out. This circumstance makes it important to study all zones of the dose-effect curves.
When studying the effect of a toxicant on the body, one should distinguish between effects, the severity of which depends gradually on the current dose (for example, a decrease in blood pressure) and “all or nothing” type effects (dead/survived). It should be taken into account that effects of the first type can almost always be converted into a form suitable for assessing effects of the second type. To determine the dose-effect relationship in a group, they usually resort to two types of experimental design:
With the formation of subgroups of studied animals;
No formation of subgroups.
These are the most commonly used toxicometry parameters. Their values are widely used for various classifications of toxic substances, two of which are given below (Table 8.3).
Classification of hazardous substances by degree of exposure
Table 8.3
| № | Index | Hazard Class | |||
| 1 - extremely dangerous | 2 - highly dangerous | 3 - moderately dangerous | 4 - slightly dangerous | ||
| 1. | MPCz, mg/m 3 | less than 0.1 | 0.1-1.0 | 1.0-10.0 | more than 10.0 |
| 2. | DLso^, mg/kg *) | less than 15 | 15-150 | 150-5000 | more than 5000 |
| 3. | DL 50, K, mg/kg **) | less than 100 | 10-500 | 500-2500 | more than 2500 |
| 4. | CL50, mg/m 3 | less than 500 | 500-5000 | 5000-50000 | more than 50000 |
| 5. | KVIO | more than 300 | 300-30 | 30-3 | less than 3 |
| 6. | 2ac | less than 6.0 | 6.0-18.0 | 18.0-54.0 | more than 54.0 |
| 7. | Zch | more than 10.0 | 10.0-5.0 | 5.0-2.5 | less than 2.5 |
When administered into the stomach, - when applied to the skin.
The “dose-effect” dependencies in the load gradient for most of the parameters had a nonlinear form and differed from the dose dependencies in the vicinity of long-running enterprises only in the “height of the step,” i.e., the degree of severity of changes in parameter values in the high-load zone. The “step height” in dose dependencies changed over time, and the change in the “step height,” as our studies revealed, in the time interval under consideration was associated with a higher rate of change in indicators in the area of medium and high loads against the background of weak expression of changes in community parameters in the area low loads.[...]
Dose-effect relationships. The body's response to exposure depends on the amount of the pollutant or its dose in the body, the magnitude of which depends on the route of entry into the body - through inhalation (inhalation), through water and food (orally), or absorbed through the skin, or exposure occurs through external exposure. Inhalation and oral routes of entry determine the biochemical modes of exposure of pollutants to the body. In general, the human body detoxifies pollutants from food more efficiently than those from inhalation.[...]
Dose-effect curves (Fig. 5.8) characterize the relationship between the dose of a pollutant and the response (effect) of the body. Dose-effect relationships for humans and animals are obtained based on data from epidemiological studies.[...]
DOSE-EFFECT APPROACH - establishing a relationship between the degree of impact on the ecosystem - dose - (eg pollution) and the resulting effect. Analysis of the dose-effect relationship makes it possible to determine the limits of ecosystem sustainability, as well as assess possible environmental damage from exposure.[...]
However, the dose-response relationship in phototropism is much more complex than it appears at first glance. Thus, in experiments on etiolated coleoptiles, it was found that with an increase in the amount of stimulation, the bend towards the light source increases, but up to a certain threshold value (approximately OD J m 2 of light energy), exceeding which leads to a decrease in the response to a certain initial value, and sometimes a “positive reaction” can even turn into a “negative” (i.e. bending [...]
Step 3. Estimation of the dose-effect relationship. At this stage, quantitative information is collected about the relationship between exposure doses and health effects.[...]
For the conditions of a linear dose-effect relationship, the values of the approximation coefficients have been established, having physical meaning risk coefficients.[...]
Curve 4 - a nonlinear dose-effect relationship with a convexity downward - is also characteristic of the body's response to the action of many factors. This is sometimes called a “sublinear” dose-response relationship. Although curve 4 does not have a clearly defined threshold, the point on the axis at which the effect can be detected determines the practical value of the threshold.[...]
Curve 2 - a nonlinear dose-response relationship with an upward convexity - represents a "supra-linear" relationship, which is observed when small doses cause disproportionately large effects. The results of observations of the population irradiated as a result of the Chernobyl accident indicate the presence of such a dependence for radiation effects in the low-dose region.[...]
As for low-dose irradiation, the indicated dependencies are also used to assess the effects in these cases in calculations that do not pretend to be accurate. In this case, preference is given to the linear form of the dose-effect relationship. [...]
To predict the frequency of cases of stochastic effects in radiation injuries, it is recommended to use a linear dose-effect relationship. The corresponding dosimetric value in this case is the equivalent dose. It should be noted, however, that at high dose levels the potential for non-stochastic effects makes the use of an effective equivalent dose unsuitable. In particular, a high dose of radiation to a single organ can cause non-stochastic effects, although non-stochastic effects are not observed when the whole body is irradiated with the same dose. [...]
Curve 1 shows that if there is a similar B-shaped dependence of the effect on the dose, then no changes in the metabolism of the human body are observed. Curves 2, 3 and 4 are non-threshold: it is assumed that there are effects at any concentration of the pollutant or any non-chemical impact, no matter how small. Such curves reflect a class of stochastic health effects. The most widely used is the linear non-threshold form of the dose-effect relationship 3, since often a judgment about the form of the dose-effect relationship in the region of low values is obtained through linear extrapolation from the region of high doses.[...]
Thus, the maximum permissible concentration can be considered as a certain point on the dose-effect relationship, dividing the zone of the maximum non-effective dose from the zone of doses that are considered unfavorable or dangerous for humans. [...]
To test the stated assumption and to determine the nature of the “dose-effect” relationships with a relatively short-term release of pollutants into the environment in the vicinity of a thermal power plant (Reftinskaya GRES, Middle Urals; the main components of emissions are sulfur dioxide, nitrogen oxides and calcium-containing solid impurities) over a period of years, the state of the herb-shrub layer of forest phytocenoses was assessed on permanent trial plots with syntopic registration of pollutant inputs. In the vicinity of this enterprise, operating since 1970, signs of degradation of forest ecosystems at the time of the beginning of observations could be traced mainly by the degree of defoliation of the crowns of the tree layer and changes in the ratio of ecobiomorphs in the herb-shrub layer.[...]
It is necessary to measure both the physicochemical composition of pollutants and the effects of their exposure on plants. Determining the concentration of components by automatic analyzers alone does not allow predicting all possible effects from exposure to air pollution, and the use of biomonitors alone does not allow assessing the level of air pollution and measuring the concentration of each phytotoxicant. Therefore, to assess the state of the environment, these types of monitoring must be combined. Measuring the concentration of pollutants, determining the parameters of the dose-effect relationship taking into account meteorological parameters can give a complete picture of the state of pollution. [...]
The development of approaches for a comprehensive analysis of the natural environment should include the study of “dose-effect” and “dose-response” relationships in various experiments, the study of the threshold of exposure to various factors and the influence of multi-medium pollutants, the development of methods for assessing the response of complex ecological systems to changes in the state of the natural environment .[...]
Possible calculation methods are based on the identification of harmfulness, followed by the establishment of the dose-effect relationship and the hazard, which together constitute the risk profile. The total assessment of this relationship gives a quantitative value of the relationship between the level of danger and health indicators.[...]
Science has developed several approaches to determining these standards. The main ones use the analysis of the “dose-effect” relationship, connecting the anthropogenic load as an input parameter of the ecosystem with its state - the output parameter.[...]
Thus, the studies have shown that even with weakly expressed changes in the parameters, the “dose-effect” relationships, as a rule, have a nonlinear form. The nonlinearity of the dose-effect relationships arises as a result different speeds changes in parameters in the load gradient, and the level of pollution determines the time for stabilization of parameters in a particular state. The lowest duration of stabilization time is typical for the area of high loads, therefore the dose-effect relationship in space has a nonlinear form, which is especially clearly manifested in the vicinity of long-term operating enterprises (pronounced impact zone and industrial desert zone). Year-to-year fluctuations that occur in communities during the interaction of exogenous and endogenous factors act as a switch from one quantitative state to another; as a result, the severity of differences between different load zones and the shape of the dose-effect relationships can change over time. When exposed to pollutants, there may be several threshold levels and areas of temporary stabilization of parameters (cascade effect of exposure).[...]
There are, however, some conditions that must be met when using the “expected” dose approach (this is indicated in the work). It is necessary that the transformation processes are subject to a linear law, and also that the dose-effect relationship is linear, and the effect is proportional to the dose or integral level of the pollutant and is not the result of synergistic effects. It is also necessary to assume that the transfer processes are stationary in time. It is more difficult to use this model for pollution, where there are significant gradients in space and time.[...]
It should be emphasized once again that assessments of long-term risks to human health from harmful emissions at various stages of fuel cycles are, unfortunately, not based on precise dose-effect relationships. In foreign studies, the dose-effect relationship between the release concentration and the health risk is assumed to be linear. For 0x and fly ash, such dependencies are much less accurate and require further clarification.[...]
However, in practice, there are a number of problems associated with determining reliable values of standard exposure indicators. They are, in particular, caused by difficulties in constructing the dose-effect relationship and determining the permissible limits of changes in the state of the ecosystem. In economics, as noted above, the significant difficulties of such assessment are due to the ambiguity in the choice of parameters characterizing the strength of the impact and the quality of the state of the ecosystem.[...]
Key words - heavy metals, acidity, forest litter, industrial pollution, biotesting, phytotoxicity, dandelion, spatial variation, dose-effect relationships, Middle Urals.[...]
Since all the studies in the above-mentioned works were carried out in the vicinity of long-term (more than 50 years) operating enterprises and the values of parameters in the vicinity of such enterprises in the area of low and high loads vary slightly from year to year (Trubina, 1996; Trubina, Makhnev, 1997), it is not clear , whether the nonlinear nature of the “dose-effect” relationships can be traced with a shorter intake of pollutants into the environment and how the nonlinear effect identified in space arises. [...]
It is known that at small values of the disturbing factor the system is able to dampen internal fluctuations and external influences and be in a state of dynamic equilibrium near the stationary state. It can be assumed that the nonlinearity of the dose-effect relationships in space arises as a result of a very low rate of change in parameters in the area of low loads and a higher rate of change in the area of high loads, and the role of a switch (trigger) from one quantitative state to another is played by annual fluctuations arising as a result of the interaction of factors of exogenous and endogenous origin.[...]
It seems important not only that there are several critical points in the factor’s action gradient - a cascade effect of influence (Trubina, 2002), but also that “switching” from one quantitative state to another occurs as a result of year-to-year fluctuations in community parameters. The same works showed that in the area of loads preceding a sharp change in community parameters, annual fluctuations have the greatest amplitude. The influence of annual fluctuations on the shape of the dose-effect relationships for individual functional parameters of the herb-shrub layer (biomass) was also shown under the influence of heavy metals in combination with sulfur dioxide (Vorobeichik, 2003).
Read also...
- Population of the USSR by year: population censuses and demographic processes All-Union Population Census 1939
- Speech material for automating the sound P in sound combinations -DR-, -TR- in syllables, words, sentences and verses
- The following word games Exercise the fourth extra goal
- Motivational theories. Motive and motivation. Theories of motivation Theories of motivation in various psychological directions